The demo always goes the same way. Someone types "create a purchase requisition for 200 units of the steel bracket from our usual vendor and route it for approval" into a…
The demo always goes the same way. Someone types "create a purchase requisition for 200 units of the steel bracket from our usual vendor and route it for approval" into a chat pane, and the AI agent finds the item, picks the vendor, fills the form, and submits the workflow. But three weeks later, that agent is in production, and the questions start: Why can this thing see payroll? Who approved it, touching the ledger? It just edited a record nobody asked it to; was that allowed?
I've now deployed enough Copilot agents for Dynamics 365 Finance & Operations to say the quiet part out loud. Building the agent is only 20% of the journey. The remaining 80%, which entails deploying, governing, monitoring, and running it safely at scale, is where the real complexity begins. This article is about the 80%.
The Demo Problem
Demos optimize for the happy path. A scripted prompt, clean data, one user, no edge cases, and a presenter who knows exactly what the agent will do because they rehearsed it. Production is the opposite of all of that. You get prompts nobody anticipated, users with wildly different permissions, dirty data, and an agent that's now allowed to act, not just answer.
The business challenge isn't "can the agent do the task?" It demonstrably can. The challenge is ownership: who is accountable for what the agent is permitted to see and do, who watches it, who gets paged when it misbehaves, and who can prove to an auditor that it stayed inside its lane. That's an operations discipline, and it's one most teams haven't built yet because the technology only made autonomous action practical very recently.
What Actually Changed
If you wired an agent to F&O over the last year, you probably used the static Dynamics 365 ERP MCP server, a fixed set of 13 tools built on the Dataverse connector framework. It worked, but it was rigid, and Microsoft is retiring it during the 2026 calendar year. The replacement, the “dynamic” Dynamics 365 ERP MCP server, went generally available in February 2026.
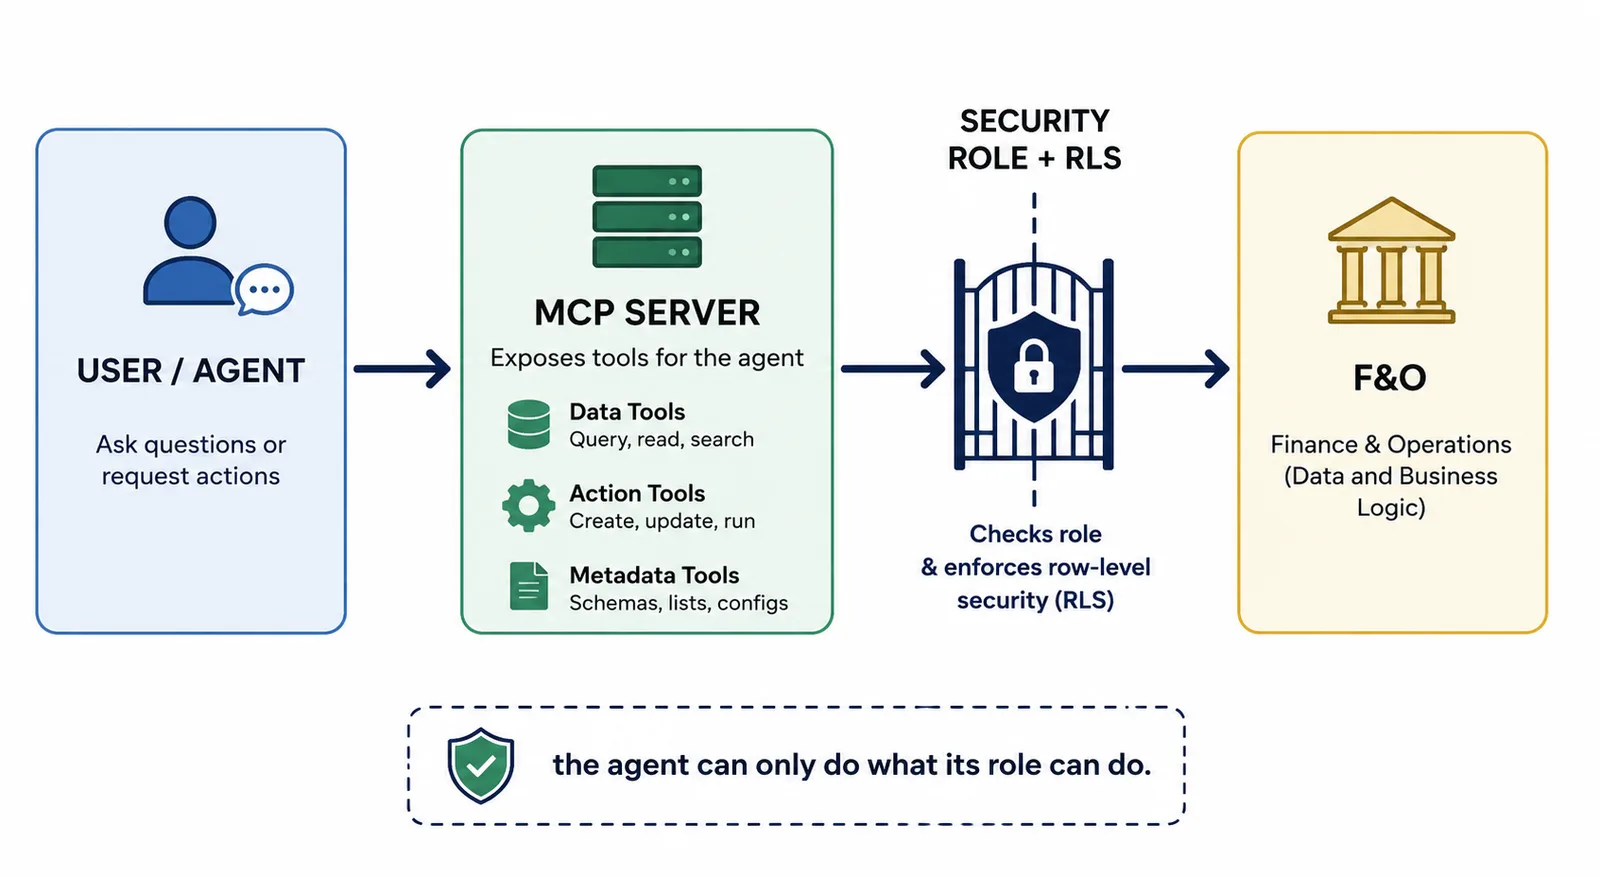
Instead of a frozen tool list, it exposes living tool categories: data tools for create/read/update/delete against entities, action tools that invoke business logic, and metadata tools the agent uses to discover your schema, including custom entities and extensions. Per Microsoft's documentation, this surfaces hundreds of thousands of ERP operations across tens of thousands of forms, without a custom connector or bespoke API. The data tools also moved off chatty form-level interactions toward direct, optimized entity operations, which is why agent responses got both faster and more reliable.
Here's the line from Microsoft Learn that matters more than any of that: when you add the MCP server to an agent, it gets access to data and business logic that matches the agent's security role and environment context. This means it gets exactly the permissions you assign it, no more, no less.
The Security Role is the Whole Ballgame
Treat the agent like a new employee on day o…
The conversation in the Dynamics world has changed. Nobody is asking whether to adopt AI anymore. The question on every project board is how to put agents to work without…
The conversation in the Dynamics world has changed. Nobody is asking whether to adopt AI anymore. The question on every project board is how to put agents to work without breaking what already runs the business.
Two years ago, Copilot in Dynamics 365 was essentially a helpful colleague who could summarize a record or draft an email. Useful, certainly, but nobody would have trusted it to act on its own. The 2026 release wave 1 marks the point where that changed. Microsoft now ships agents across Sales, Customer Service, Finance and Supply Chain that do not simply answer questions. They take a business goal expressed in plain language, break it into concrete steps, and carry those steps out inside the system.
The clearest example is the Contact Center, which Microsoft is turning into a fully agentic environment. Cases get triaged, routed, drafted and in many instances resolved before a human ever opens them. Containment rates, the share of inquiries handled entirely without human involvement, have become a headline metric in customer service projects. On the finance side, the new autonomous Payflow Agent takes over payment processing tasks that used to consume hours of accounts payable time every week.
What this changes for implementation work
Anyone who has sat through a Dynamics implementation knows the traditional shape of the work: requirements, configuration, data migration, training, support. Agents add a layer that behaves differently from anything consultants have deployed before. An agent is not a workflow. It does not follow a fixed path, and its behavior depends on the quality of the data and knowledge it can reach.
That has practical consequences. Data hygiene, long treated as a cleanup task to squeeze in before migration weekend, is now a precondition for the headline features working at all. An agent drafting customer responses from a knowledge base full of outdated articles will confidently produce outdated answers. Teams that skipped the unglamorous work of curating their content are discovering that the bill has arrived.
Scoping also changes. Clients increasingly arrive with expectations set by consumer AI tools and assume the same fluency will appear in their ERP on day one. Part of the consultant's job in 2026 is expectation management: being clear about what agents do well today, where they still need human review, and which processes are genuinely ready to hand over.
Augmentation, not replacement
A theme that came through strongly at this year's community events is that the organizations getting real value from agents are not using them to cut headcount. They are using them to remove repetitive work so that sales teams sell, service teams solve the difficult cases, and finance teams spend their time on analysis rather than data entry. The productivity gain is real, but it shows up as better output from the same people, not as an empty desk.
That framing matters for adoption too. Users who believe an agent is bei…
When people talk about Microsoft Dynamics 365, the conversation usually stays within CRM, sales or ERP territory. The EV industry almost never comes up. In my opinion tha…
When people talk about Microsoft Dynamics 365, the conversation usually stays within CRM, sales or ERP territory. The EV industry almost never comes up. In my opinion that is a missed opportunity, because the operational problems holding back charging networks today are exactly the kind of problems this platform was designed to solve. I believe integrating Dynamics 365 into the EV world would shape it in a clearly positive way, and this article explains why.
The industry has an operations problem, not a technology problem
EV charging has grown fast, and the software behind it has not kept up. Most operators run on a patchwork of systems. Asset records sit in one platform, fault tickets in another, contractor management in a spreadsheet, and customer support somewhere else entirely. None of these talk to each other properly.
The result is familiar to anyone who has dealt with public charging. A charger goes down, nobody notices until a driver complains, an engineer is sent out with the wrong information, and the fix takes days instead of hours. Every one of these failures’ chips away at public confidence in EVs. If drivers cannot trust that a charger will work, they hesitate to switch from petrol. So poor operations are not just a cost issue, they slow down the energy transition itself.
One view of the asset changes everything
The core value of Dynamics 365 in this industry would be a single view of every asset. One record per charger that holds its installation details, maintenance history, fault patterns, contractor visits and customer complaints. Today that information is scattered, and decisions suffer for it.
With a unified view, an operator can spot that a particular charger model fails twice as often in coastal locations, that a certain contractor closes jobs faster than others, or that a site with repeated complaints also has a grid connection issue. These insights exist in the data already, they just cannot surface when the data lives in five places.
Field service is where the biggest gains sit
Field work is one of the largest cost centres for any charging operator, and slow charging makes it worse. The assets are cheap and spread across hundreds of small sites, so a single wasted site visit can wipe out months of revenue from the unit it was meant to fix.
Dynamics 365 Field Service brings intelligent scheduling, route optimisation, automated work orders and mobile workforce management. None of this is exotic technology but applied across thousands of chargers it changes the economics of a network. Fewer wasted visits, faster repairs, better contractor accountability, higher uptime follows, and uptime is the single metric that matters most to drivers, site hosts and councils.
The path from reactive to predictive
The most exciting part is what becomes possible once operations run on one platform. Chargers already produce telemetry. Combine that with maintenance history and machine learning, and failures can be predicted before they hap…
What actually happened The 2026 pattern for this is the "AI tool" (Microsoft's word for it — you'll also hear "AI plugin"). You write a normal X++ class, deploy it, and d…
What actually happened
The 2026 pattern for this is the "AI tool" (Microsoft's word for it — you'll also hear "AI plugin"). You write a normal X++ class, deploy it, and decorate it with a couple of attributes. AIPluginOperationAttribute marks the class as something an agent is allowed to call. CustomAPIAttribute ties it to a Dataverse Custom API. Your inputs and outputs are just data contract members with plain-language descriptions:
X
[CustomAPIRequestParameter('The customer account number', true),
DataMember('accountNumber')]
public CustAccount parmAccountNum(CustAccount _accountNum = accountNum)
That description string is the part I want you to notice. It's not a comment — the orchestrator actually reads it to decide when to call your action and how to fill the parameter from someone's messy sentence. You're basically writing prompt hints in your method signatures now. Weird. Kind of great.
Why this matters to you and me
Here's the shift. These are headless operations — no form context, no client. Once your class is deployed with the right menu-item security, the Dynamics 365 ERP MCP server picks it up automatically through its find_actions / invoke_action tools. Same code, reachable from the in-app sidecar, from a custom Copilot Studio agent, or from any agent speaking MCP. You write the logic once; the surface area is enormous.
The honest catch: it's still preview, you need the unified developer environment, and there's Dataverse plumbing (the Custom API, request params, response props) plus the classic flush the cache with SysFlushAOD or nothing works gotcha that cost me twenty minutes.
My takeaway: stop thinking of your X++ classes as things only a form can call. Pick one small, useful calculation you already trust — a balance, an eligibility check, a status lookup — wrap it as an AI tool, and let Copilot reach it. It's the most direct line I've found from "code I already have" to "AI that does something real."
When people talk about Microsoft Dynamics 365, the conversation usually stays within CRM, sales or ERP territory. The EV industry almost never comes up. In my opinion tha…
When people talk about Microsoft Dynamics 365, the conversation usually stays within CRM, sales or ERP territory. The EV industry almost never comes up. In my opinion that is a missed opportunity, because the operational problems holding back charging networks today are exactly the kind of problems this platform was designed to solve. I believe integrating Dynamics 365 into the EV world would shape it in a clearly positive way, and this article explains why.
The industry has an operations problem, not a technology problem
EV charging has grown fast, and the software behind it has not kept up. Most operators run on a patchwork of systems. Asset records sit in one platform, fault tickets in another, contractor management in a spreadsheet, and customer support somewhere else entirely. None of these talk to each other properly.
The result is familiar to anyone who has dealt with public charging. A charger goes down, nobody notices until a driver complains, an engineer is sent out with the wrong information, and the fix takes days instead of hours. Every one of these failures’ chips away at public confidence in EVs. If drivers cannot trust that a charger will work, they hesitate to switch from petrol. So poor operations are not just a cost issue, they slow down the energy transition itself.
One view of the asset changes everything
The core value of Dynamics 365 in this industry would be a single view of every asset. One record per charger that holds its installation details, maintenance history, fault patterns, contractor visits and customer complaints. Today that information is scattered, and decisions suffer for it.
With a unified view, an operator can spot that a particular charger model fails twice as often in coastal locations, that a certain contractor closes jobs faster than others, or that a site with repeated complaints also has a grid connection issue. These insights exist in the data already, they just cannot surface when the data lives in five places.
Field service is where the biggest gains sit
Field work is one of the largest cost centres for any charging operator, and slow charging makes it worse. The assets are cheap and spread across hundreds of small sites, so a single wasted site visit can wipe out months of revenue from the unit it was meant to fix.
Dynamics 365 Field Service brings intelligent scheduling, route optimisation, automated work orders and mobile workforce management. None of this is exotic technology but applied across thousands of chargers it changes the economics of a network. Fewer wasted visits, faster repairs, better contractor accountability, higher uptime follows, and uptime is the single metric that matters most to drivers, site hosts and councils.
The path from reactive to predictive
The most exciting part is what becomes possible once operations run on one platform. Chargers already produce telemetry. Combine that with maintenance history and machine learning, and failures can be predicted before they hap…
Over the last two articles I built the asset management picture from the ground up: first the foundation of functional locations, assets, and asset types , then the preve…
Over the last two articles I built the asset management picture from the ground up: first the foundation of functional locations, assets, and asset types, then the preventive side, where maintenance plans, rounds, and triggers project a forecast of work. I kept making the same promise at the end of each one, that the work order is the thing that finally posts cost when it is ended, and I kept deferring the detail. Today I pay that debt. I want to follow a maintenance work order all the way through execution and into money: where it comes from, how it schedules against the people and the equipment, how it picks up labour hours and spare parts from the same inventory the shop floor draws on, and the exact moment the cost becomes a financial fact that finance can see.
WHERE THE WORK ORDER COMES FROM
A maintenance work order in Dynamics 365 has two parents. The first is preventive: the forecast I described last time generates work orders from due plan lines, so a calendar trigger or a counter reading quietly turns into a scheduled job without anyone typing it in. The second is corrective: something breaks or someone notices a problem, a maintenance request is raised, and that request is converted into a work order. Either way you land on the same object, and that is the design intent. Whether the work was planned a year out or reported five minutes ago, it flows through one consistent lifecycle so the maintenance team has a single backlog to schedule and a single place where cost accumulates. A work order carries one or more work order jobs, and each job names a job type and a trade, exactly the controlled vocabulary the plan lines use, which is why the taxonomy decisions from the foundation article keep paying off here.
THE WORK ORDER LIFECYCLE
The work order moves through a sequence of lifecycle states, and the states are not cosmetic. They gate what you are allowed to do and, crucially, when cost is recognised. A new order is created, then scheduled, then it goes in progress while the work is actually done, then it is completed when the technician is finished on the floor, and finally it is ended. That last transition is the one that matters financially. Until the order is ended, the hours and parts on it are estimates and commitments; they show you what the job is expected to consume and they let you plan, but they have not yet hit the ledger. Ending the order is the act that posts the real cost. I labour this point because it is the single most common source of confusion I see: people look at an in-progress order, see numbers, and assume finance has them, when in fact nothing has posted until the order reaches the ended state.
Each lifecycle state is configurable, so an implementation can add intermediate states or control which user groups may move an order forward. That is useful for governance, for example requiring a supervisor to push an order from completed to ended so there is a review step before cost is committed. The principle to hold…
In my last article on the Asset Management foundation I laid out the structure that everything in Dynamics 365 Asset Management hangs from: functional locations as the st…
In my last article on the Asset Management foundation I laid out the structure that everything in Dynamics 365 Asset Management hangs from: functional locations as the stable places, assets installed into them, asset types as the maintenance taxonomy, and the work order as the thing that finally posts cost when it is ended. I closed with a promise to go a level deeper into the preventive side, and that is where I want to spend today. Preventive maintenance is the part of the module that earns its keep, because it is the difference between equipment that fails on its own schedule and equipment that gets attention before it fails on yours. I will walk through maintenance plans and maintenance rounds, the two ways preventive work is defined, how time-based and counter-based triggers actually generate a forecast of work, and how to keep that forecast from either burying your technicians or quietly drying up.
WHY PLAN PREVENTIVE WORK AT ALL
Corrective maintenance is reactive: something breaks, someone raises a request, a work order follows. It is necessary, but if it is all you do then your maintenance team lives in a permanent state of firefighting and your production schedule inherits every surprise breakdown as an unplanned gap. Preventive maintenance flips the timing. Instead of waiting for failure, you decide in advance that a given asset needs a given task at a given cadence, and Dynamics 365 projects those tasks into the future as a forecast you can see, resource, and schedule. The payoff is twofold: fewer unplanned outages, and a maintenance workload you can level and staff for rather than one that arrives in unpredictable spikes. The whole preventive apparatus exists to turn "we should probably service that every so often" into a concrete, dated, costed stream of work orders.
MAINTENANCE PLANS: THE BUILDING BLOCKS
The maintenance plan is where preventive work is defined. A plan is attached either to an asset type, so it applies to every asset of that type, or to an individual asset when something is special enough to deserve its own rules. Attaching to the asset type is the move that scales: define the plan once for "hydraulic press" and every press inherits it, which is exactly why the asset type taxonomy from the foundation article matters so much here. A plan that is too granular, written asset by asset, becomes a maintenance burden in its own right.
Inside the plan sit one or more plan lines, and the line is where the real configuration lives. Each line names a maintenance job type (the controlled vocabulary I argued for last time: inspection, lubrication, calibration, replacement), the trade or worker capability the job needs, an interval that says how often, a start date that anchors the cadence, and the trigger rule that decides whether the interval is counted in calendar time or in usage. One plan can carry several lines, so a single press might have a monthly visual inspection, a quarterly lubrication, and an annual overhaul all defi…
I am stepping sideways from master planning for a few articles, at Joni's request, into a corner of Dynamics 365 Supply Chain Management that production-heavy shops lean…
I am stepping sideways from master planning for a few articles, at Joni's request, into a corner of Dynamics 365 Supply Chain Management that production-heavy shops lean on but that gets far less airtime than manufacturing or warehousing: Asset Management, the module Microsoft used to call Enterprise Asset Management. If you run lines, presses, ovens, conveyors, or any equipment that has to keep running, this is where Dynamics 365 tracks what you own, where it sits, what condition it is in, and the maintenance work that keeps it alive. This first article lays the foundation, the structure everything else hangs from, because almost every problem I see in an Asset Management rollout traces back to the structure being rushed.
WHY ASSET MANAGEMENT EARNS ITS PLACE
Maintenance is the quiet partner of production. A finite-capacity schedule is only honest if the resources it schedules are actually available, and a resource that is down for an unplanned repair makes a liar of the plan. Asset Management gives you a structured way to record assets, plan preventive maintenance so failures happen less often, capture corrective work when they happen anyway, and post the cost of all that work where finance can see it. It is fully inside Supply Chain Management rather than bolted on, so a maintenance asset can be tied to the same resource your production orders consume, and the maintenance work order can draw spare parts from the same inventory your shop floor draws from. That integration is the reason to use it instead of a standalone CMMS, and it is also why getting the structure right matters: the structure is what connects maintenance to the rest of the system.
THE ASSET HIERARCHY: FUNCTIONAL LOCATIONS AND ASSETS
There are two foundational objects, and people constantly blur them. A functional location is a place in your operation where an asset can sit: a site, an area, a production line, a cell, a room. Functional locations are arranged in a parent and child hierarchy, so a line sits under an area, which sits under a site. An asset is the physical thing itself: the specific pump, the specific press, the specific forklift. The asset is installed at a functional location, and that relationship is the hinge of the whole module.
The reason to separate the two is that places outlast equipment. A pump fails for good and you replace it; the slot on the line where it lived does not change. If you have built your history around the functional location, you can ask "how much has this position on the line cost me over five years" across every asset that has ever occupied it, and you can swap the physical asset in and out without losing that thread. Build everything around the asset alone and you lose continuity every time you replace a machine. So I model the places first, as a stable skeleton, and then install assets into them.
Two settings shape the skeleton. A functional location type classifies what kind of place each node is, and the functional location structu…
A question I get from finance and operations alike is some version of "what does this item actually cost us once it is sitting on our shelf?" For domestically sourced goo…
A question I get from finance and operations alike is some version of "what does this item actually cost us once it is sitting on our shelf?" For domestically sourced goods the purchase price is close enough. For anything imported it is not, because freight, insurance, customs duty, brokerage and handling can add up to a large fraction of the product price, sometimes rivalling it. Carrying inventory at the bare purchase price quietly overstates your margin and distorts every decision downstream. Today I want to walk through landed cost in Dynamics 365: the dedicated Landed Cost module that captures these charges against a shipment, and, just as important, how that cost actually lands in your inventory valuation depending on the costing method you run. The first part is configuration; the second is where finance either trusts the numbers or does not.
WHAT LANDED COST ACTUALLY MEANS
Landed cost is the fully burdened unit cost of getting an item to your location and ready to sell or consume. It is the product price plus every incremental cost incurred along the way: ocean or air freight, inland haulage, marine insurance, import duty, customs brokerage, port handling, demurrage, and agent fees. The goal is simple to state and harder to do well: take all of those charges, attach them to the goods that incurred them, and spread them fairly across the units so that each unit carries its true cost. Once you have that, your inventory value is honest, your margin reporting is real, and your sourcing decisions (make versus buy, this vendor versus that one, near versus far) are made on the right numbers.
THE LANDED COST MODULE: VOYAGES AND JOURNEYS
The dedicated Landed Cost module in D365 is built for import-heavy operations and introduces a vocabulary worth learning. The central object is the voyage, which represents a physical shipment, typically a container or a consolidation of purchase order lines travelling together. A voyage groups the goods that share the same transport and therefore should share the same transport costs. A journey template describes the route and the legs that voyage travels (for example origin port, ocean leg, destination port, inland leg), and it carries the structure that drives which costs apply and when milestones are expected. You set up the templates once to mirror how your goods actually move, then create voyages against them as shipments happen, attaching the relevant purchase order lines.
The reason this structure exists, rather than just dumping a freight charge on a purchase order, is that real import costs are incurred at the shipment level and must be apportioned down to many order lines and items. A single container might hold lines from several purchase orders; the ocean freight is one invoice for the whole box, and it needs to be split across everything inside. The voyage is the container for that logic.
COST TYPES AND AUTO CHARGES
Each kind of cost is defined as a cost type: freight, duty, insurance, and so on, ea…
In my last article on static and dynamic master plans I settled where master planning writes its results and why most setups run two plans. I closed with a promise to fol…
In my last article on static and dynamic master plans I settled where master planning writes its results and why most setups run two plans. I closed with a promise to follow the planned orders forward: how you turn those suggestions into real purchase and production orders, and how to read the action and futures messages that tell you what to reschedule before the warehouse ever feels it. That is today. The planned order is the most underrated object in D365 planning, because it is the hinge between a calculation and a commitment, and the habits a team builds around firming and messages decide whether planning is a tool people trust or a list they ignore.
WHAT A PLANNED ORDER ACTUALLY IS
A planned order is a suggestion and nothing more. When master planning runs, it nets demand against supply for each item and, where it finds a shortfall, it proposes an order to cover it: a planned purchase order for a bought item, a planned production order for a manufactured one, a planned transfer order to move stock between warehouses, or a planned kanban depending on your setup. None of these touch the real world yet. They carry no purchase order number, they place no demand on a vendor, and they consume no shop floor capacity beyond the plan. The crucial consequence of this is that planned orders are disposable. On the next regeneration the engine throws them away and recreates them from scratch, so anything you change on a planned order that you do not firm is lost. That disposability is a feature, not a flaw, but it catches people who spend an hour tidying planned orders and then watch the overnight run erase the lot.
Because planned orders are tied to the plan, the question of which plan you are looking at, from the previous article, matters here. You firm from the static plan of record, not the dynamic plan, precisely because the static plan holds still long enough for the firming decision to mean something.
FIRMING: TURNING A SUGGESTION INTO A COMMITMENT
Firming is the act of converting a planned order into a real order. When you firm a planned production order you get an actual production order with a number, a BOM and route attached, and a real claim on capacity. Firm a planned purchase order and you get a purchase order ready to confirm and send to the vendor. The moment of firming is the moment planning stops being advisory and starts creating obligations, so it deserves a deliberate process rather than a reflex click.
There are three broad ways to firm. The first is manual, one order at a time, from the planned orders list page: you review a suggestion, you agree with it, you firm it. The second is selective and batched: you mark a set of planned orders, often filtered to a buyer or a production unit or a date window, and firm them together. The third is automatic, governed by the firming time fence. Inside that fence the engine treats near-term suggestions as reliable enough to firm without a human in the loop, which is sensible for stable, fast-…
Last time I wrote about coverage groups and the core planning parameters , the per-item settings that decide how master planning turns demand into planned orders. I promi…
Last time I wrote about coverage groups and the core planning parameters, the per-item settings that decide how master planning turns demand into planned orders. I promised to keep going with master planning, and before we follow planned orders forward into firming and messages, there is a structural question worth settling: the plan itself. When you run master planning, what is it writing into, and why do almost all real setups run not one plan but two? The answer is the difference between a static plan and a dynamic plan, and getting it right is the difference between a planner who trusts the plan and one who watches it change every time someone enters a sales order.
WHAT A MASTER PLAN ACTUALLY IS
A master plan in D365 is two things at once. It is a named configuration, a header that carries settings about how the run behaves, and it is the container that holds the results of the run: the planned orders, the action messages, and the futures messages. So when I say "the static plan" I mean both a set of parameters and the body of suggestions sitting under it. You can have several master plans defined, and you nominate which ones play which role in the Master planning parameters. Two roles matter: the current static master plan and the current dynamic master plan. Those two nominations are the quiet decision that shapes everyone's daily experience of planning.
STATIC VERSUS DYNAMIC PLANS
A static plan is the plan of record. It is recalculated on a controlled schedule, typically a full regeneration in an overnight batch, and then it sits still until the next run. That stillness is the point. A planner can open the static plan in the morning, see a coherent set of planned orders, and work through them (reviewing, adjusting, firming) without the ground shifting because someone three desks away just keyed a large order. The static plan is stable precisely because it does not react to every transaction the moment it happens.
A dynamic plan is the opposite by design. It updates continuously as supply and demand change, so it always reflects the very latest picture. The moment a sales order line is entered, the dynamic plan rebalances net requirements for that item. This is exactly what you want behind order entry and delivery date promising, where the business needs an up-to-the-minute answer to "if I sell this today, when can I have it." The dynamic plan is volatile, and that is fine, because nobody is firming orders from it; they are reading availability from it.
WHY MOST SETUPS RUN TWO PLANS
The reason two plans exist is that one plan cannot be both stable and live at the same time, and a healthy operation needs both qualities. Planners need stability to make decisions; order entry needs currency to make promises. Run a single plan and you are forced to choose which group to disappoint.
There is a specific trap here that catches people. If you nominate a current static plan but leave the current dynamic plan blank, D365 will update that single stat…
For two weeks I have been deep in the warehouse: wave templates, cycle counting, replenishment, inbound flows, and last time the mobile device menu in the operator's hand…
For two weeks I have been deep in the warehouse: wave templates, cycle counting, replenishment, inbound flows, and last time the mobile device menu in the operator's hand. I promised at the end of that article to step back from the floor and into planning, because everything the warehouse moves has to be made or bought first, and the thing that decides what to make and buy, and when, is master planning. This is the first of a few articles on it, and I want to start where the behaviour actually lives: the mobile device menu was the doorway to warehouse work; coverage groups are the doorway to planning. Get them right and the plan is sensible. Get them wrong and you spend your days explaining strange planned orders.
WHAT MASTER PLANNING IS ACTUALLY DOING
Strip master planning down to its core and it is a comparison. On one side it gathers demand: sales order lines, the demand forecast, transfer and production requirements, and any safety stock you have asked it to hold. On the other side it gathers supply that already exists: on-hand inventory plus open purchase, production, and transfer orders. It nets the two together, item by item and warehouse by warehouse, across the timeline, and wherever demand outruns available supply it raises a planned order to cover the gap. Those planned orders are suggestions, not commitments, until somebody firms them into real purchase, production, or transfer orders. That loop is the whole engine. What makes two companies running the same engine get completely different plans is the configuration that decides how the gap gets covered, and that configuration is mostly the coverage group.
COVERAGE GROUPS: WHERE THE BEHAVIOUR LIVES
A coverage group is a reusable bundle of planning settings that you attach to items so the engine knows how to treat them. You do not configure planning item by item from scratch; you build a handful of coverage groups that describe the patterns you have, then point each item at the group that fits. A fast-moving stocked component, an expensive made-to-order assembly, and a cheap consumable each want different treatment, and a coverage group is how you express that difference once and reuse it. The single most important field on the group is the coverage code, because it decides how individual requirements get grouped into planned orders and therefore how many orders you get and how much buffer they carry.
THE FOUR COVERAGE CODES
There are four coverage codes, and choosing among them is the first real decision you make for any item.
• Requirement. The engine raises one planned order for each demand line, sized exactly to that line. This is lot-for-lot planning: the tightest possible inventory and the most orders. It suits high-value or made-to-order items where you never want stock sitting idle.
• Period. The engine groups all demand that falls inside a defined period (for example a week) into a single planned order. You get fewer, larger orders and a little more buffer, which suits items w…
In my last article on inbound flows I closed with a promise to come to the device in the operator's hand: the warehouse mobile device menu in D365 Advanced Warehouse Mana…
In my last article on inbound flows I closed with a promise to come to the device in the operator's hand: the warehouse mobile device menu in D365 Advanced Warehouse Management. Menu items, work classes, and how to design handheld flows that the floor will actually use without fighting the device. Every piece of physical movement I have written about in this series, picking, replenishment, cycle counting, receiving, put-away, reaches the operator through one screen: the mobile device menu. You can have immaculate work templates and location directives behind the scenes, but if the menu the picker sees is a deep, confusing tree of half-relevant options, the floor will be slow, error-prone, and quietly inventing workarounds. The menu is where all that back-end design either becomes usable or gets in the way.
WHAT THE MOBILE DEVICE MENU ACTUALLY IS
The warehouse mobile device menu is the tree of options an operator navigates on the handheld, from the top-level menu down through submenus to the individual actions they tap to do a job. Each leaf in that tree is a mobile device menu item, and each menu item is a small piece of configuration that decides exactly what happens when the operator selects it. Menus can contain other menus, so you can group actions by function and keep any single screen short. The whole structure is assigned to operators through their work user setup, which means different roles can see completely different menus: a receiver does not need to scroll past picking and packing options, and a picker should not be one mis-tap away from a counting flow. Designing the menu well is mostly about two questions: what is each menu item, and how is the tree arranged.
TWO MODES: WORK AND INDIRECT
The single most important setting on a menu item is its mode, and there are two. A work-mode menu item drives warehouse work: it either processes work that already exists (an operator picks up directed picking or put-away work) or it creates work as the operator acts (receiving a purchase order line generates the put-away work). Work-mode items are the ones wired to the work templates and location directives I covered in the two tables that run your warehouse; the menu item is simply the doorway through which that work reaches the floor.
An indirect-mode menu item is for everything that is not warehouse work: an item or location inquiry, a pause or break, a cleaning task, switching the active user. These do not create or process work; instead each maps to an indirect activity code, which is what lets you measure how much of the shift was spent off productive work. Getting the mode right is the first decision, because almost everything else about the item follows from it. The mistake I see most often is people reaching for complex configuration when the real problem is simply that an action was modelled as the wrong mode.
WORK CLASSES: THE GUARD RAIL ON WORK ITEMS
For a work-mode item, the work class is the setting that keeps it pointed at the righ…
In my last article on inbound flows I closed with a promise to come to the device in the operator's hand: the warehouse mobile device menu in D365 Advanced Warehouse Mana…
In my last article on inbound flows I closed with a promise to come to the device in the operator's hand: the warehouse mobile device menu in D365 Advanced Warehouse Management. Menu items, work classes, and how to design handheld flows that the floor will actually use without fighting the device. Every piece of physical movement I have written about in this series, picking, replenishment, cycle counting, receiving, put-away, reaches the operator through one screen: the mobile device menu. You can have immaculate work templates and location directives behind the scenes, but if the menu the picker sees is a deep, confusing tree of half-relevant options, the floor will be slow, error-prone, and quietly inventing workarounds. The menu is where all that back-end design either becomes usable or gets in the way.
WHAT THE MOBILE DEVICE MENU ACTUALLY IS
The warehouse mobile device menu is the tree of options an operator navigates on the handheld, from the top-level menu down through submenus to the individual actions they tap to do a job. Each leaf in that tree is a mobile device menu item, and each menu item is a small piece of configuration that decides exactly what happens when the operator selects it. Menus can contain other menus, so you can group actions by function and keep any single screen short. The whole structure is assigned to operators through their work user setup, which means different roles can see completely different menus: a receiver does not need to scroll past picking and packing options, and a picker should not be one mis-tap away from a counting flow. Designing the menu well is mostly about two questions: what is each menu item, and how is the tree arranged.
TWO MODES: WORK AND INDIRECT
The single most important setting on a menu item is its mode, and there are two. A work-mode menu item drives warehouse work: it either processes work that already exists (an operator picks up directed picking or put-away work) or it creates work as the operator acts (receiving a purchase order line generates the put-away work). Work-mode items are the ones wired to the work templates and location directives I covered in the two tables that run your warehouse; the menu item is simply the doorway through which that work reaches the floor.
An indirect-mode menu item is for everything that is not warehouse work: an item or location inquiry, a pause or break, a cleaning task, switching the active user. These do not create or process work; instead each maps to an indirect activity code, which is what lets you measure how much of the shift was spent off productive work. Getting the mode right is the first decision, because almost everything else about the item follows from it. The mistake I see most often is people reaching for complex configuration when the real problem is simply that an action was modelled as the wrong mode.
WORK CLASSES: THE GUARD RAIL ON WORK ITEMS
For a work-mode item, the work class is the setting that keeps it pointed at the righ…
In my last article on replenishment I closed with a promise to turn around and face the other direction: inbound flows in D365 Advanced Warehouse Management. Purchase ord…
In my last article on replenishment I closed with a promise to turn around and face the other direction: inbound flows in D365 Advanced Warehouse Management. Purchase order and load-based receiving, license plate receiving on the mobile device, and how put-away location directives decide where received stock actually lands. Outbound gets most of the attention because it is where the orders ship, but everything outbound depends on inbound having done its job. If receiving puts stock in the wrong place, or records the wrong quantity, or leaves a license plate stranded with no put-away, then every wave, every replenishment, and every cycle count downstream is working from a lie. Inbound is the quiet half of the warehouse where inventory accuracy is either won or lost.
THE TWO WAYS STOCK ARRIVES
D365 gives you two main entry points for inbound stock, and the right choice depends on how much you know before the truck arrives. The first is purchase order receiving. You receive directly against the lines of a purchase order, item by item, and the system already knows what was ordered, so it can validate quantities against the expectation. This is the simplest model and it suits operations where receiving is driven straight off the PO and there is no separate advance notice from the supplier.
The second is load-based receiving. Here an inbound load is created, often from an advance shipping notice (ASN) sent by the supplier, and the load carries the expected contents ahead of the physical arrival. Receiving then happens against the load rather than the raw PO. Load-based receiving is the better fit when you want to plan dock and labour around known arrivals, when one shipment spans several purchase orders, or when the supplier sends structured ASN data you want to receive against. The mental model is the mirror image of the outbound load I wrote about in the outbound wave and load strategy article: a load is just a planned container of work, and inbound loads let you treat receiving with the same discipline you give shipping.
Both routes converge on the same next step. Once stock is received, the warehouse no longer cares whether it came from a PO line or a load line; it cares about the license plate that now exists and needs to be put away.
THE LICENSE PLATE IS THE UNIT OF RECEIVING
In Advanced WMS the license plate is the handle the whole system grabs onto. A license plate is a tracked unit of stored inventory, usually a pallet or a container, identified by a single ID that travels with the goods. When you receive, you are almost always receiving onto a license plate: the act of receiving creates or populates a plate, records the item, quantity, unit, and inventory status on it, and parks it at a receiving location. From that moment the plate is the thing that moves. Put-away work moves a plate, not a loose quantity; picking later can pull from a plate; cycle counting counts a plate. Getting the license plate right at receipt, one plate per physical p…
In my last article on cycle counting I promised to come back to replenishment in D365 Advanced Warehouse Management: minimum and maximum replenishment, demand-based and l…
In my last article on cycle counting I promised to come back to replenishment in D365 Advanced Warehouse Management: minimum and maximum replenishment, demand-based and load demand strategies, and how to keep pick faces stocked without burying the warehouse in unnecessary moves. Replenishment is the quiet engine behind a fast pick operation. Get it right and pickers walk short distances to locations that are always stocked; get it wrong and they either stand waiting for stock to arrive or the warehouse spends half its labour shuffling pallets that nobody needed moved. It is the same balancing act I keep coming back to in this series: the system will happily create work, and the skill is in creating only the work that earns its keep.
THE PICK FACE AND THE RESERVE
Almost every efficient warehouse splits storage into two roles. Bulk or reserve locations hold inventory in its most compact form: full pallets and license plates, stacked high, optimised for density rather than access. Pick faces, often fixed picking locations assigned to a specific item, hold a small working quantity at floor level where a picker can reach it quickly. Outbound picking should pull almost entirely from the pick faces, because that is where the travel is short and the work is predictable. Replenishment is simply the discipline of moving stock from the reserve to the pick face before the picker needs it, so that the fast path stays fast. Everything that follows is about deciding when that move happens and how big it is.
THREE WAYS REPLENISHMENT GETS TRIGGERED
D365 gives you three practical mechanisms, and a mature operation usually runs more than one of them at once.
• Min/max replenishment. The workhorse for fixed pick locations. You define a minimum and a maximum quantity for the location, and a scheduled batch job tops it back up to the maximum whenever on-hand falls below the minimum. It is wave-independent: it does not care what orders are in the system, only that the pick face should never run dry. This is what keeps your high-velocity items permanently stocked.
• Wave demand replenishment. Configured as a step on the wave template, this looks at the actual demand in a wave and, if the pick locations cannot cover it, creates replenishment work as part of wave processing. It is demand-based and precise: it only moves what the orders in front of you actually require. This is the safety net for items that do not warrant a permanent min/max, or for demand spikes that outrun the scheduled top-up.
• Load demand replenishment. Triggered for a specific load, this stages the stock a known shipment will need ahead of releasing the work to the floor. It suits operations that plan in loads and want the pick faces primed before a big outbound run, rather than discovering shortfalls mid-wave.
THE REPLENISHMENT TEMPLATE
Whichever trigger you use, the rules live in a replenishment template, and it is worth understanding what that object actually does. The template defines the demand…
I closed the cost to complete article with a promise to come back to the warehouse: cycle counting in D365 Advanced Warehouse Management. Inventory accuracy is one of tho…
I closed the cost to complete article with a promise to come back to the warehouse: cycle counting in D365 Advanced Warehouse Management. Inventory accuracy is one of those metrics nobody talks about until it is bad, and by then every downstream process is paying for it: master planning ordering material you already have, waves releasing picks against stock that is not in the location, and month-end variances nobody can explain. A well-built cycle counting program is the cheapest insurance the module offers, and Dynamics gives you everything you need; the catch is that the pieces are scattered across half a dozen forms and only behave well together if you set them up as one system.
WHY CYCLE COUNTING INSTEAD OF THE ANNUAL COUNT
The traditional wall-to-wall count has three problems: it stops the operation, it is staffed by tired people counting unfamiliar stock at speed, and the accuracy it buys starts decaying the morning after. Cycle counting inverts the model: count a small slice of the warehouse continuously, with the people who work in it, while it runs. Errors get caught weeks after they happen instead of months, which means the root cause is still findable. And in most jurisdictions auditors will accept a robust cycle count program in place of the full physical count, provided you can demonstrate coverage: every item and location counted at a defined frequency, with documented variance handling. That word, demonstrate, drives a lot of the setup decisions below.
THREE WAYS COUNT WORK IS BORN
Everything in this process produces the same object: warehouse work of type cycle counting, queued and routed like any other work, which is why the work template and work pool plumbing I covered earlier matters here too. The differences are in the trigger.
1. Cycle count plans. The scheduled backbone. A plan holds selection criteria for locations and items, a maximum number of counts to generate per run, and the number of days that must pass before a location or item is counted again. A batch job executes the plan on its schedule and creates the work. This is the instrument that gives you provable coverage.
2. Cycle count thresholds. The opportunistic counter. A threshold watches on-hand in a location, by quantity or by percentage, and when a pick drops the location below the limit, the system creates count work for it automatically. The logic is simple economics: the best moment to count a location is when it is nearly empty, because the count takes seconds and is hard to get wrong.
3. Spot counting. The judgement call. A supervisor who distrusts a location creates count work for it directly, or a worker initiates a spot count from the mobile device. No schedule, no trigger, just suspicion, and a healthy program leaves room for it.
BUILDING PLANS THAT COVER THE WAREHOUSE
The classic structure is frequency by velocity. Fast-moving A items are touched constantly, so they accumulate errors fastest and earn the tightest cadence; slow C items barely move an…
So I went to add a tool to one of my agents last week and Microsoft Learn quietly informed me that the static Dynamics 365 ERP MCP server is being retired this calendar y…
So I went to add a tool to one of my agents last week and Microsoft Learn quietly informed me that the static Dynamics 365 ERP MCP server is being retired this calendar year. My first reaction was, honestly, mild panic — I have agents in production leaning on that thing. My second reaction, after actually reading what's replacing it, was: oh, this is better. A lot better.
What's actually changing
If you connected an agent to F&O over the last year, you probably wired it to the static MCP server — a fixed set of tools, pointed mostly at OData. It worked, but it was rigid. You got what you got.
The new dynamic ERP MCP server is the replacement, and the word "dynamic" is doing real work here. Instead of a frozen tool list, it exposes three living categories — data tools, action tools, and metadata tools — that let an agent do nearly anything a user can do through the UI. No custom connector, no bespoke API, no glue code you'll be maintaining at 2am.
The part that made me sit up: the data tools are moving operations off OData and onto SQL under the hood. If you've ever watched an agent grind through a chatty OData query against a big table, you know exactly why that matters. Faster responses, and — this is the underrated bit — better responses, because the agent can navigate ERP data intelligently instead of guessing its way through entity relationships.
Why you should care this week
Two reasons. One, if you've got anything pointed at the static server, the clock is ticking — migrating to the dynamic server isn't optional, it's a "do it before it's an incident" item. Put it on the board now.
Two, and more fun: agents can now open the actual record or attachment behind a Copilot response. That sounds small. It isn't. It's the difference between an agent that asserts something and an agent that shows its work — and trust is the whole ballgame when you're letting AI touch financial data.
Takeaway: Go check whatever you built on the static MCP server, plan the move to the dynamic one, and while you're in there, lean into the SQL-backed data tools. The migration is a chore. What you get on the other side genuinely isn't.
I ended the ETO projects article with a promise: the money side. Fixed-price estimates, revenue recognition, and the cost to complete number that drives what the customer…
I ended the ETO projects article with a promise: the money side. Fixed-price estimates, revenue recognition, and the cost to complete number that drives what the customer, the auditor, and your own management see. This is the point in an engineer-to-order implementation where the supply chain consultant and the finance consultant have to sit at the same table, and the part most often configured on autopilot and regretted at the first year-end audit.
WHY FIXED-PRICE CHANGES THE QUESTION
On a time-and-material project the accounting is almost trivial: cost goes in, you bill it with a margin, and revenue follows the invoice. Fixed-price work breaks that link. The customer pays agreed milestones on agreed dates, and those dates have very little to do with how much of the job you have actually done. If you recognised revenue whenever you invoiced, the P&L would show a spectacular month every time a milestone lands and ugly losses in between. So the real accounting question becomes: how complete is this job, defensibly, right now? Everything below is machinery for answering that question every period and posting the result.
THE BUILDING BLOCKS
Five pieces of setup decide how the whole process behaves, and all of them exist before the first estimate is posted.
• The project forecast. Hours, items, expenses, and fees forecast against the project, held in a dedicated forecast model. This is the denominator of everything: total expected cost and total contract value. If the forecast is fiction, every number downstream is fiction too.
• The revenue recognition method. The project group decides whether the project runs on completed percentage (revenue recognised progressively as the job advances) or completed contract (everything held as WIP and recognised at the end). For long ETO jobs, completed percentage is usually the only method that gives management a usable monthly P&L.
• The estimate project. A fixed-price project carries an attached estimate project, which is where completion is calculated and estimates are posted. Several fixed-price projects can share one estimate project when they are commercially one deliverable and should be assessed together.
• The cost template. The most underrated object in the module. It groups project cost lines and decides two things: which cost categories count toward completion, and whether the completion percentage is calculated automatically from cost or entered manually. Almost every revenue distortion I have been asked to diagnose traces back to this object.
• The period code. How often estimates run. Monthly, aligned with the financial close, is the sensible default.
COST TO COMPLETE: THE NUMBER EVERYTHING HANGS ON
The completion percentage in a cost-based setup is a simple ratio: actual cost to date divided by total expected cost, where total expected cost is actual cost plus cost to complete. Actual cost is a fact; cost to complete is a judgement, and that judgement is the single most important number in fixed-p…
In my last article on engineer-to-order I ended on a promise: the money side of a fixed-price ETO job, how the estimate and revenue recognition actually behave in Dynamic…
In my last article on engineer-to-order I ended on a promise: the money side of a fixed-price ETO job, how the estimate and revenue recognition actually behave in Dynamics 365. This is that article, and it builds directly on using the Projects module for ETO. If the project is the spine of an ETO job, then the estimate is its nervous system. It is the number every status meeting circles back to, and it is what decides how much revenue and profit the job is allowed to show before a single unit has shipped.
WHY FIXED-PRICE NEEDS AN ESTIMATE, NOT JUST A FORECAST
A time-and-material project is simple to account for: you bill cost (plus margin) as it lands, and revenue follows invoicing. A fixed-price project cannot work that way, because the price is agreed up front and the cost arrives unevenly over months. If you let revenue track invoicing on a fixed-price ETO job, your profit lurches around with milestone billing dates and tells you nothing about how the job is really doing. The answer Dynamics gives you is the estimate: a periodic process that looks at how much cost has been incurred against the total expected cost, works out how complete the job is, and recognises revenue and work in process (WIP) accordingly. Estimates are a feature of fixed-price and investment projects specifically; a time-and-material project does not use them.
THE FORECAST IS NOT THE ESTIMATE
These two words get used interchangeably on the floor, and that causes real confusion, so it is worth being precise. The forecast is what you build before and during the job: forecast lines for hours, items, expenses, and fees that represent what you expect to spend and bill. It is your bid model and your baseline. The estimate is the period-end accounting process that consumes actuals and a cost-to-complete figure to produce recognition entries. The forecast feeds the estimate (it is one source of the total cost figure), but they are not the same object. You can have a perfectly good forecast and still get recognition wrong if the estimate process is set up badly, and vice versa.
BUILDING A CREDIBLE FORECAST
Everything downstream leans on the total estimated cost being believable, so this is where the care belongs. A few things I always check:
• Forecast by category, not in a lump. Separate hours, items, expenses, and subcontracted services so that when one line drifts you can see which one. A single blended number hides the problem until close.
• Tie the item and hour forecast to the engineered BOM and route once engineering has produced them. Before engineering is finished you are working with a rough order-of-magnitude figure, and that is fine, but flag it as such and tighten it the moment the structure firms up.
• Include the fees and the expenses that are easy to forget: freight, commissioning, travel, warranty provisions. On long ETO jobs these are not rounding errors.
• Keep a contingency line that is visible and owned, rather than padding every category quietly. Hidden paddin…
Here's a small frustration that turned out to matter more than I expected. We had gorgeous Power BI reports — and almost nobody looked at them. Why? Because they lived in…
Here's a small frustration that turned out to matter more than I expected. We had gorgeous Power BI reports — and almost nobody looked at them. Why? Because they lived in a different tab, behind a different login, away from the screen where people actually did their work. The day we pulled those visuals into F&O itself, usage shot up. Same reports. Different home. Turns out "out of sight, out of mind" is very real in ERP land.
So if you've got dashboards gathering dust, here's what I've learned about bringing them home.
The good news: the service is already there
If you're on a cloud-hosted multibox deployment, the Power BI Embedded service is deployed and configured for you automatically. New deployments come bundled with it. That removed the biggest excuse I used to hear — "we'd need to set up infrastructure first." You mostly don't.
Think in workspaces, not just reports
The thing that changed how I design: you can drop a Power BI-driven overview page right onto a workspace. Workspaces are already where users land to get a bird's-eye view — count tiles, KPIs, quick links. Adding live visuals there means the insight shows up exactly where the decision happens, not three clicks away. You can also wire menu items to specific reports and surface them as links inside the workspace.
You're still a developer here, not just a clicker
This is the part I genuinely enjoy: you use the familiar F&O programming concepts. Associate menu items with Power BI reports, embed them in workspaces, and — this is the important bit — apply role-based and task-based security to those menu items. The same security model you already trust governs who sees what. No bolt-on permissions to babysit.
Where the data comes from
For the heavier, near-real-time reports, Entity store is the operational data store built specifically for this. Model your reports in Power BI Desktop against it and you get high-volume analytics without hammering the transactional tables.
The takeaway
Great analytics that nobody opens aren't great analytics. Embedding Power BI into F&O isn't really about charts — it's about removing the distance between the number and the person who needs to act on it. Put the insight where the work already happens, secure it with the model you already use, and watch adoption take care of itself.
I'll be honest: the first time I opened Electronic Reporting in F&O, I closed it again pretty quickly. All those configurations, data models, and formats stacked on top o…
I'll be honest: the first time I opened Electronic Reporting in F&O, I closed it again pretty quickly. All those configurations, data models, and formats stacked on top of each other — it felt like a maze someone built just to test my patience. A few years and a lot of regulatory formats later, I actually like it now. So here are the things that finally made ER click for me, the stuff I wish a colleague had pulled me aside and shared on day one.
Flip the design switch first
This one bit me for an embarrassingly long time. If your designer feels read-only and nothing's editable, go to the Electronic reporting parameters page and set Enable design mode to Yes. That's it. No magic, no support ticket. I genuinely lost an afternoon to this once.
Don't rebuild the data model — derive from it
The real unlock for me was realizing ER is built in layers. You import a data model configuration (often straight from the Global repository), and then your format configuration derives from it. You're not redoing the plumbing every time — you're sitting on top of Microsoft's model and just describing how the document should look. Once that clicked, my configs got smaller and a lot easier to maintain.
Keep your dev work in its own sandbox
You can edit and test configurations in a development instance as a separate copy, using the ER developer or functional consultant role. Treat it like real code: experiment there, break things there, and only promote the version you trust. Future-you, staring at a production format that suddenly stopped generating, will thank you.
Lean on the repository for versioning
ER has its own lifecycle — versions, dependencies, draft vs completed states. Use it. Don't hand-copy XML around and hope for the best. When you mark a version complete and let the dependency chain do its job, upgrades and hotfixes stop being scary.
The takeaway
ER isn't really a reporting tool — it's a little no-code data-transformation language hiding inside F&O. Stop fighting it like X++ and start thinking in models and formats that build on each other. Once you do, those intimidating regulatory requirements turn into something you can actually knock out in an afternoon.
Today I will write about something I get asked about constantly: how to actually run engineer-to-order (ETO) work in Dynamics 365, and specifically how the Projects modul…
Today I will write about something I get asked about constantly: how to actually run engineer-to-order (ETO) work in Dynamics 365, and specifically how the Projects module ties together with planning and production. It is a fair request, because ETO is where the three areas stop being separate modules and start being one process, and the place they meet is the project.
WHY ETO IS A DIFFERENT ANIMAL
In make-to-stock or even make-to-order, the item is known, the BOM exists, and you are mostly deciding quantities and timing. ETO breaks that assumption. Each order is, to some degree, designed for the customer: the BOM and route may not exist until engineering creates them, lead times are long, the commercial deal is often fixed-price or milestone-billed, and the thing the business actually wants to track is not an item, it is a job with a budget. That last point is the key. In ETO the natural unit of control is the project, not the item, and Dynamics is built to let the project be that unit.
THE PROJECTS MODULE AS THE ETO SPINE
The Projects module (Project management and accounting) gives you the container that holds everything else. A project carries the work breakdown structure, the budget or estimate, the cost categories, the work in process (WIP), and the rules for how cost becomes revenue. For ETO you almost always want a fixed-price or an investment-style project rather than a simple time-and-material one, because you need WIP to accumulate and revenue to recognise against an estimate rather than billing costs as they land.
A few structural pieces matter from day one:
• Project contract and project. The contract holds the customer and the funding rules; the project (or project hierarchy) holds the work. One contract can carry several projects when a job has distinct phases or deliverables.
• Categories and groups. Project categories classify hours, items, and expenses; the project group ties the project to its ledger posting and WIP rules. Get these right early, because they decide whether your cost lands where finance expects it.
• Estimates and forecasts. The project forecast (hours, items, expenses, fees) is both your bid model and the baseline you will measure actuals against for the life of the job.
ITEM REQUIREMENTS: WHERE A PROJECT BECOMES DEMAND
Here is the connection most people miss. A project does not create production demand just by existing. The bridge is the item requirement. An item requirement is a project-owned line that behaves, for supply chain purposes, almost exactly like a sales order line: it represents a quantity of an item that the project needs by a date, and it is visible to master planning as demand. When you deliver against it, it generates the packing slip and the customer invoice, and the cost flows to the project.
So the modelling decision in ETO is this: the engineered end item (and any major sub-assemblies you want to track) becomes an item requirement on the project. That single act is what pulls the planning…
If there is one piece of configuration in D365’s Advanced Warehouse Management module that quietly decides whether your outbound operation hums or grinds, it’s the wave t…
If there is one piece of configuration in D365’s Advanced Warehouse Management module that quietly decides whether your outbound operation hums or grinds, it’s the wave template. I’ve seen warehouses where pickers stand idle waiting for work because waves only process on a manual click, and I’ve seen the opposite: floors flooded with hundreds of tiny work orders because every sales line releases into its own wave. Both problems trace back to the same screen: Warehouse management > Setup > Waves > Wave templates.
In this article I want to walk through how wave templates really work, the decisions you need to make before touching the configuration, and the settings that most often get misunderstood.
What a wave actually is
A wave is a grouping mechanism. When you release demand to the warehouse (sales orders, transfer orders, or production orders for raw material picking), the system needs to decide when and how to turn that released demand into warehouse work. The wave is the container that collects released lines, and wave processing is the moment that container is turned into pick work via the work templates and location directives.
This matters because the wave is your throttle. If you process too eagerly, you lose the ability to consolidate picks; if you process too lazily, your release-to-pick lead time balloons.
There are three wave types (Shipping, Production, and Kanban), and each warehouse and wave type combination evaluates wave templates in sequence, top to bottom, using the template’s filter criteria: site, warehouse, and any query you add. The first template whose criteria match wins. Sequence matters enormously: put your most specific templates at the top and your catch-all at the bottom, or your carefully crafted “carrier X express orders” template will never be hit.
Here is the full lifecycle from release to a picker’s scanner, with the decision points the wave template controls:
The four automation flags people confuse
On every wave template you’ll find a cluster of toggles that control automation, and in my experience these are the most frequently misconfigured settings in the whole module.
Automate wave creation. When a line is released to the warehouse, the system either adds it to an existing open wave that matches the template, or creates a new wave for it. If this is off, someone has to create waves manually from the All waves form. Most operations want this on.
Process wave at release to warehouse. This is the aggressive one. The moment demand is released, the wave is processed immediately and work is created right away. It works well for same-day, high-urgency flows. It works poorly if you want to consolidate multiple orders into efficient pick paths, because each release event processes on its own and you forfeit batching.
Process wave automatically at threshold. The wave accumulates lines until it hits a threshold you define (weight, shipment count, or line count) and then processes itself. This is the middle ground I e…
I closed the shop floor execution article with a promise: quality management in production, quality orders, where to trigger them in the flow, and what to do with the mat…
I closed the shop floor execution article with a promise: quality management in production, quality orders, where to trigger them in the flow, and what to do with the material they catch. Here it is, and the thesis up front: the quality module in D365 Supply Chain Management is mostly a trigger table plus discipline. The software part is quick to configure. The expensive mistakes are inspecting in the wrong place and having no agreed plan for what happens when an inspection fails, and neither of those is a parameter.
WHAT A QUALITY ORDER ACTUALLY IS
A quality order is an inspection record: an item, a quantity to sample, a test group containing one or more tests, and a result per test. Tests come in two flavors. Quantitative tests carry a minimum, target, and maximum (a dimension, a torque, a concentration), and the result is a number judged against that window. Qualitative tests carry a test variable with defined outcomes (pass/fail, color match yes/no), and the result is a chosen outcome. The test group bundles the tests with their sequence, instruments, documents, and an acceptable quality level, and validation of the whole order is a pass/fail verdict computed from the individual results.
You can create quality orders manually, and for one-off investigations you will. But the real machinery is automatic generation through quality associations, because an inspection that depends on someone remembering to create it is an inspection that stops happening in week three.
QUALITY ASSOCIATIONS: THE TRIGGER TABLE
A quality association is a rule: for this reference type (purchase, production, route operation, sales, inventory), at this event and execution point (before or after registration, before or after report as finished, at a specific operation), for this item scope (a specific item, an item group, or all items), generate a quality order using this test group and this sampling plan. The collection of these rules is the trigger table, and it deserves the same design respect as location directives get in the warehouse: a small number of deliberate rules beats a sprawl of overlapping ones, and specific rules win over general ones, so keep the general rules few and the exceptions explicit.
WHERE TO TRIGGER IN THE PRODUCTION FLOW
For a manufactured item there are three natural trigger points, and the design question is which combination earns its cost:
• Material receipt (purchase registration). A quality association on the purchase reference type, triggered at registration, stops vendor defects at the door. This is the cheapest place to catch a defect; the material has consumed no capacity yet, and the disposition conversation is with the vendor, not with your own production manager.
• In-process, at a route operation. The route operation reference type generates a quality order when a specific operation reports, before downstream operations add value on top of a defect. The rule of thumb I push hard: inspect where the characteristic is created. If th…
I closed the production scheduling article with a promise: shop floor execution, the production floor execution interface, and what good job feedback discipline does for…
I closed the production scheduling article with a promise: shop floor execution, the production floor execution interface, and what good job feedback discipline does for both scheduling accuracy and costing. Here it is, and the one-sentence thesis up front: everything I wrote about scheduling percentages and standard cost variances assumes the feedback coming off the floor is true, and the floor only gives you true feedback if you make truth the easiest thing to register.
WHAT PRODUCTION FLOOR EXECUTION ACTUALLY IS
Production floor execution (PFE) is the touch-first interface D365 Supply Chain Management gives shop floor workers, the successor to the old job card terminal and job card device. Workers sign in with a badge ID or credentials on a shared terminal, see the jobs queued for their resource or resource group, and act: start a job, report progress quantity, register material consumption, report as finished, declare downtime or indirect time. The interface is deliberately configurable per terminal: a machining cell terminal can expose start/stop and quantity only, while a packaging line terminal also shows material registration and quality controls. Configure each terminal for the cell that uses it; a screen full of irrelevant buttons is how bad feedback starts.
A few setup notes worth knowing: terminals are defined as devices with their own action layout and resource filter, sign-in options support badge plus PIN, and one worker can be active on multiple jobs (bundling) when one operator genuinely runs several machines at once. If you remember the load percentage discussion from the scheduling article, bundling is its execution-side twin.
THE TWO LOOPS THAT FEEDBACK FEEDS
Every registration on the floor flows into two loops:
• The scheduling loop: started and finished jobs report actual setup and run times against the route's theoretical times. That stream of actuals is the only honest source for the resource efficiency percentages I discussed in the scheduling article. If actuals are fiction, your efficiencies are fiction, and the schedule the floor complains about is fiction of their own making.
• The costing loop: time and quantity registrations post through production journals (route card or job card) onto the production order, becoming the actual labor and machine cost that ending the order compares against the standard from the cost roll-up. Sloppy feedback lands directly in production variances that the controller then spends month-end explaining.
One stream of button presses, two financial and operational consequences. That is why feedback discipline is worth a daily article and not a footnote.
WHAT BAD FEEDBACK LOOKS LIKE (YOU HAVE SEEN ALL OF THESE)
• Shift-end batching: workers start and finish all their jobs in the last ten minutes of the shift. Quantities are right; every duration is garbage. Scheduling actuals become useless and labor cost smears across the wrong jobs.
• Ghost jobs: a job started Monday and never finished, s…
I promised after the BOM line types article that I would come back to production scheduling, and specifically to the three things that decide whether your schedule is a p…
I promised after the BOM line types article that I would come back to production scheduling, and specifically to the three things that decide whether your schedule is a plan or a fiction: the finite versus infinite capacity choice, how resource groups and resources relate, and the percentages hiding in resources and calendars that quietly stretch or shrink every operation time.
TWO ENGINES: OPERATIONS SCHEDULING AND JOB SCHEDULING
D365 schedules production with two distinct engines and people mix them up constantly.
Operations scheduling works at the resource group level and in day buckets. It answers "which days will this order occupy the machining group" without choosing a specific machine or sequencing jobs within the day. It is fast, stable, and the right granularity for order promising and medium-term capacity views.
Job scheduling breaks each operation into jobs (setup, process, transport and so on), assigns specific resources, and sequences to the minute. It is what the shop floor sees on the job list, and what Gantt-level decisions run on.
A pattern that serves most plants well: master planning and order creation run operations scheduling; job scheduling happens closer to execution, for a short horizon (days, not weeks), where the data is real enough to deserve minute-level precision. Job scheduling a six-week horizon produces beautiful schedules that are wrong by Thursday.
FINITE VERSUS INFINITE: WHAT THE FLAG ACTUALLY DOES
Infinite capacity scheduling places operations at their ideal dates and lets resources overload. Finite capacity makes the schedule respect available capacity: if the machining group is full on Tuesday, the operation moves.
The instinct of every new implementation is to turn finite capacity on everywhere, because it sounds more accurate. Resist it. Finite everywhere means every disturbance ripples through the whole schedule; one late material receipt reshuffles three weeks of work, and planners stop trusting the system because the plan changes every time they look at it.
The pattern that works is finite capacity only where capacity is genuinely scarce:
• Identify the true bottleneck resources (usually one or two per value stream, and everyone on the floor already knows which they are).
• Mark only those as finite; leave the rest infinite. Non-bottleneck overloads are noise; the bottleneck schedule is the plant schedule.
• Use the capacity scheduling time fence in master planning so finite logic only applies inside a horizon where the data deserves it; beyond that, infinite is honest about being an estimate.
One more flag people forget: finite capacity has to be enabled both on the resource and respected by the scheduling run's parameters. If schedules look overloaded despite finite resources, check which side is off; it is usually the run parameters on a batch job someone copied years ago.
RESOURCE GROUPS, RESOURCES, AND CAPABILITIES
Routes should almost never name specific resources. The route operation points at re…
In my last article I walked through engineering changes and how to get a revision into BOMs and production orders cleanly. I ended on a promise: the costing side. Because…
In my last article I walked through engineering changes and how to get a revision into BOMs and production orders cleanly. I ended on a promise: the costing side. Because every BOM change is also a cost change, and if engineering and finance do not coordinate their cutovers, the result is a month of variance analysis meetings where nobody can explain the numbers.
This article is about standard cost specifically. If your manufactured items run on moving average or FIFO, BOM changes flow into cost through actual consumption and you have a different (easier) life. Standard cost is where timing discipline matters.
HOW STANDARD COST GETS BUILT
A manufactured item's standard cost in D365 is not entered; it is calculated. The BOM calculation rolls up component costs from the item cost prices, labor from the route (run time and setup against cost categories), and overhead through the costing sheet's indirect cost nodes. The result lands in a costing version as a pending cost with an effective date, and it does nothing until someone activates it.
That separation between pending and active is the whole control mechanism. You can calculate as often as you like, review the calculation details level by level, and only the activation moves the number that values inventory and measures production.
Three configuration points worth checking on your costing version setup before any of this matters: the blocking flag (prevents accidental activation), the fallback principle (where the calculation finds component prices that have no pending cost themselves), and whether your costing version records cost by site, because multi-site manufacturers with different routes per site need site-specific standards.
A BOM CHANGE DOES NOT CHANGE COST (UNTIL YOU MAKE IT)
Here is the point people miss: activating a new BOM version changes what production consumes. It does not change the standard cost of the parent. The standard stays whatever was last activated, calculated from the old structure. From the moment the engineering cutover happens until the moment a new standard is activated, you are deliberately running with a standard that no longer matches the build.
That is not automatically a problem. It is a measurable, explainable state, as long as you know what it does to variances.
THE VARIANCE MECHANICS
When a production order on the new BOM finishes and you run end-of-order costing against the old standard, the difference between what the order actually consumed and what the standard says it should contain shows up as production variances. The useful ones to watch in this scenario:
• Substitution variance: the order consumed component B where the standard cost roll-up contains component A. This is the classic engineering-change signature; a spike here right after a cutover is expected and healthy.
• Quantity variance: the new structure uses more or less of a component than the standard assumed.
• Price variance: the component's actual cost differs from the standard componen…
When I talk to production managers about their biggest recurring headaches, engineering changes come up more often than anything else. A revision lands, and suddenly nobo…
When I talk to production managers about their biggest recurring headaches, engineering changes come up more often than anything else. A revision lands, and suddenly nobody is sure which BOM version the shop floor is building against, whether the orders already released should finish on the old revision or be pulled back, and why the warehouse just picked a component that engineering obsoleted two weeks ago. The change itself is rarely the problem. The propagation is.
D365 Supply Chain Management gives you two mechanisms for handling this: the classic BOM versioning model that has been in the product since the AX days, and the Engineering Change Management (ECM) module. In this article I will cover both, and, more importantly, the part most implementations leave undefined: what happens to production orders that are already in flight when the revision changes underneath them.
THE FOUNDATION: BOM VERSIONS AND EFFECTIVITY
Everything starts with the fact that an item does not have "a BOM" in D365; it has BOM versions, each with an approval status, an activation flag, and effectivity criteria: from/to dates, from/to quantities, and site. When planning or a production order needs a BOM, the system selects the active, approved version whose effectivity matches the date, quantity, and site of the demand.
That selection logic is your simplest change mechanism. A clean revision cutover without any extra modules looks like this:
1. Create a new BOM version for the item (copy the old one as a starting point).
2. Make the component changes on the new version.
3. Set the new version's from-date to the cutover date, and the old version's to-date to the day before.
4. Approve and activate the new version.
From that point, every planned order and every new production order with a delivery date past the cutover picks up the new structure automatically. Master planning is date-sensitive here, which surprises people: planned orders scheduled before the cutover still explode the old version, and orders after it explode the new one. That is exactly what you want for a phase-in driven by component run-out.
The weakness of doing this manually is governance. Nothing forces a where-used analysis, nothing tracks why the change happened, and nothing stops a planner from activating a version while purchasing still has three months of the old component on order. That is the gap ECM closes.
ENGINEERING CHANGE MANAGEMENT: THE GOVERNED PATH
The ECM module adds a controlled lifecycle around exactly the steps above. The pieces that matter:
• Engineering products: items created under an engineering category, owned by an engineering legal entity, carrying a version that is either a separate field or an actual product dimension (more on that choice below).
• Engineering change requests (ECR): the formal "we have a problem or an idea" record. Anyone can raise one; it carries no product data changes itself.
• Engineering change orders (ECO): the executable change. An ECO bundles the af…
When I review manufacturing implementations, one of the first things I open is a handful of BOMs, because the line type choices on those lines tell me almost everything a…
When I review manufacturing implementations, one of the first things I open is a handful of BOMs, because the line type choices on those lines tell me almost everything about how production orders, planning, and costing will behave downstream. The line type field looks like a small detail, but it decides whether a component generates its own production order, dissolves into its parent, drives a purchase order, or hands work to a subcontractor. Get it wrong and you'll fight phantom symptoms for months: planners drowning in unnecessary orders, costs landing in the wrong place, or warehouse work appearing for material that never physically moves.
In this article I'll walk through each of the four line types, when each one earns its place, and how the choice interacts with BOM depth: the flat-versus-deep structure question every manufacturer eventually faces.
THE FOUR LINE TYPES, BRIEFLY
Every BOM line in D365 carries one of four line types:
• Item: the default. The component is consumed from inventory. If it's a manufactured item, planning creates a separate planned production order for it; if purchased, a planned purchase order.
• Phantom: the component's own BOM is exploded into the parent's production order at estimation. No separate order, no inventory transaction for the phantom item itself.
• Pegged supply: a dedicated supply order (production or purchase) is created and hard-pegged to the parent production order, marked to it one-to-one.
• Vendor: the line represents a subcontracted service; the parent production order generates a purchase order to the subcontractor, tied to the routing operation.
Each behaves differently in planning, scheduling, costing, and warehouse execution. The decision tree below summarizes the choice; the rest of the article unpacks each branch.
ITEM: WHEN THE COMPONENT HAS A LIFE OF ITS OWN
Use the Item line type when the component is genuinely stock-managed: it's built or bought in its own lot sizes, possibly for multiple parents, and you want inventory between the levels. This is the right answer for shared subassemblies: a motor used across ten finished products, a sauce base used in twenty recipes. Planning treats each level independently, applying that item's own coverage settings, lot sizes, and lead times.
The cost of that independence is decoupling: each level means its own production order, its own report-as-finished, its own picking work in the warehouse, and its own scheduling step. In an advanced warehouse, every intermediate level is a put-away plus a pick. If a subassembly exists only because engineering drew it that way (never stocked, never shared, built only in the context of one parent), making it an Item line creates pure administrative overhead.
PHANTOM: COLLAPSING ENGINEERING STRUCTURE OUT OF EXECUTION
That's exactly what Phantom is for. Engineering often needs intermediate levels (a "wiring kit," a "hardware bag," a logical grouping of components) that manufacturing never physically builds or s…
Sign in to join the conversation — reading is free, talking needs a name.
New here?
Dynamics Hub is where D365 consultants and the companies that need them
actually talk to each other. Jobs are free, the community is open, and
the daily challenges are dangerously addictive.